Macroeconomic indicators such as GDP, inflation, unemployment, and interest rates play a central role in understanding how economies evolve and how financial markets respond. For developers, analysts, and fintech teams, working with this type of data requires a clear understanding of how it is structured and delivered.
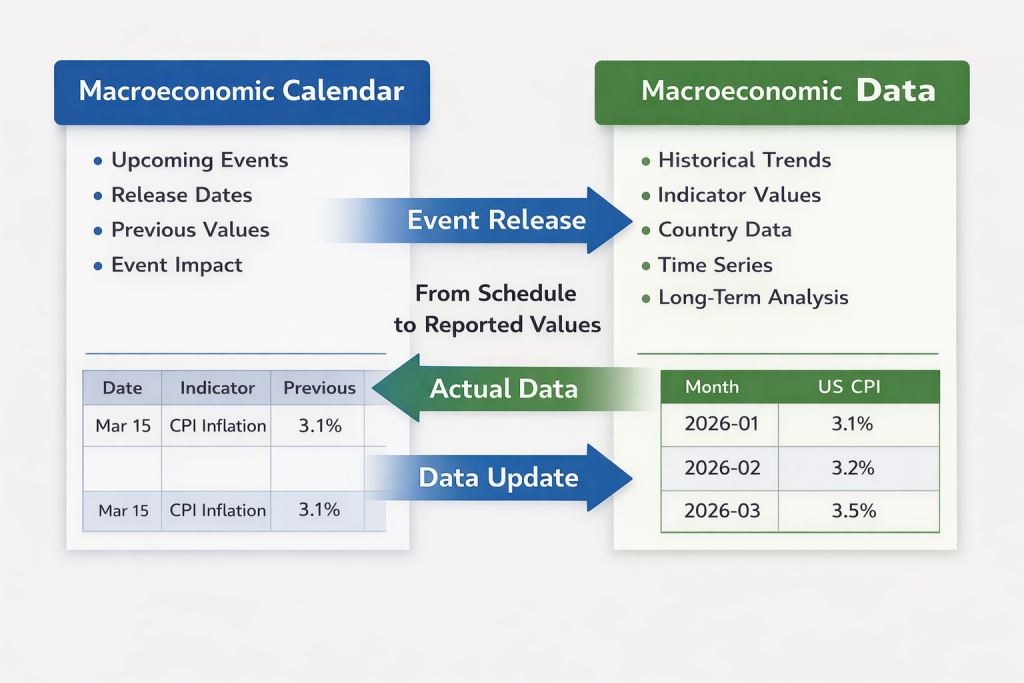
In practice, macroeconomic information is typically divided into two complementary layers: event-based data and reported values. The first layer represents the schedule of upcoming economic releases, while the second provides the actual published figures and historical datasets.
Understanding how these two layers interact is essential for building reliable financial tools, from trading platforms and economic dashboards to research and analytics systems. This guide explains how macroeconomic calendars and data APIs fit together and how they are used in real-world applications.
What Is a Macroeconomic Calendar?
A Macroeconomic Calendar is a schedule of upcoming economic events and data releases. It helps users track when important reports will be published and prepares systems for possible market volatility.
Typical calendar data includes:
- Country
- Indicator name
- Release date and time
- Previous value
- Actual value
- Consensus value
- Importance or impact level
| Field | Example |
|---|---|
| Country | United Kingdom |
| Indicator | Retail Sales MoM |
| Date | Jan 19, 2024 |
| Time | 07:00 |
| Previous | 1.4% |
| Consensus | -0.5% |
| Actual | -3.2% |
| Impact | High |
In simple terms, a macroeconomic calendar answers the question: When will this economic statistic be released?
What Is Macroeconomic Data?
Macroeconomic Data refers to the actual reported values of economic indicators, usually stored as historical time series. This is the data analysts, researchers, developers, and models use for trend analysis, forecasting, and visualization.
Typical macroeconomic data includes:
- Inflation rates
- GDP growth
- Unemployment rates
- Interest rates
- Retail sales
- Industrial production
| Date | Indicator | Value |
|---|---|---|
| 2026-01 | US CPI | 3.1% |
| 2026-02 | US CPI | 3.2% |
| 2026-03 | US CPI | 3.5% |
In simple terms, macroeconomic data answers the question: What value was reported?
Macroeconomic Calendar vs Macroeconomic Data
Although these two datasets are related, they are not the same. One is event-focused, and the other is value-focused.
| Feature | Macroeconomic Calendar | Macroeconomic Data |
|---|---|---|
| Main purpose | Track scheduled releases | Store actual historical values |
| Focus | Upcoming events | Reported indicator values |
| Time orientation | Future and scheduled releases | Past and current datasets |
| Used for | Preparation, alerts, event monitoring | Analysis, charts, models, research |
| Typical users | Traders, news platforms, fintech apps | Analysts, quants, economists, researchers |
How They Work Together
The strongest use case appears when both data types are used together. A macroeconomic calendar tells a system that a release is coming. Once the event happens, macroeconomic data provides the actual number.
Macroeconomic Calendar → Scheduled Release → Actual Reported Value → Updated Historical Dataset
For example:
- The calendar shows that US CPI will be released at 08:30.
- The event includes previous values, consensus expectations, and the reported actual value.
- When the release happens, the actual CPI number becomes available.
- That actual value is then added to the macroeconomic data time series.
This relationship is why developers often integrate both APIs in the same application.
How Developers Use These APIs
Developers building financial tools use macroeconomic calendars and macroeconomic datasets in different parts of the workflow.
1. Trading Platforms
Trading platforms use a macroeconomic calendar to show upcoming releases, send alerts, and warn users about high-impact news. After publication, they use macroeconomic data to update charts, statistics, and dashboards.
2. Quantitative Research
Quant researchers use the calendar to identify event timestamps and then compare them with market moves. Historical macroeconomic data is used to test relationships between economic indicators and asset prices.
3. Economic Dashboards
Dashboard builders use upcoming event data for scheduling and monitoring, while historical macroeconomic data is used for charts, trend analysis, and visual comparisons across countries.
4. AI and Forecasting Models
AI systems and forecasting models use macroeconomic data as training inputs. A macroeconomic calendar can also help trigger model refreshes whenever new official economic statistics are released.
Example Developer Workflow
A common developer workflow looks like this:
- Fetch upcoming events from a Macroeconomic Calendar API
- Display release time, previous value, consensus expectations, and impact level
- Wait for the event to be published
- Fetch the actual reported number from a Macroeconomic Data API
- Update dashboards, charts, alerts, or models
This approach is especially useful for applications that need both event awareness and historical analysis.
Why These Two APIs Are Often Used Together
Many financial and economic applications are incomplete without both layers. A calendar alone tells you that something important is about to happen, but not how the data changed over time. Historical data alone gives you trend context, but not when the next important release will occur.
Together, they create a much more useful system for:
- Market monitoring
- Economic research
- Forecasting models
- Fintech dashboards
- News-driven trading tools
- Institutional research platforms
Final Thoughts
The difference between Macroeconomic Calendar and Macroeconomic Data is simple but important.
A Macroeconomic Calendar tells you when an event is scheduled.
Macroeconomic Data tells you what the reported value is.
For developers, analysts, and fintech companies, these datasets work best together. One helps you prepare for economic events, and the other helps you measure, analyze, and visualize the outcome.
Frequently Asked Questions
What is an economic calendar?
An economic calendar is a schedule of macroeconomic events such as GDP releases, CPI reports, employment data, and central bank decisions.
Why is the economic calendar important?
Economic calendar events often cause market volatility. Traders, analysts, and financial platforms use this data to anticipate price movements, compare actual values with forecasts, and manage risk.
What is the difference between an economic calendar and macroeconomic data?
An economic calendar focuses on event schedules and release timing, while macroeconomic data APIs usually focus on reported values, historical data, and indicator time series.
How can I access economic calendar data via API?
You can use the Fin2Dev Macroeconomic Calendar API to retrieve structured economic events, and the Macroeconomic Data API to access reported macroeconomic values and related datasets.
Explore Related APIs
Looking to integrate macroeconomic releases and historical indicators into your platform?